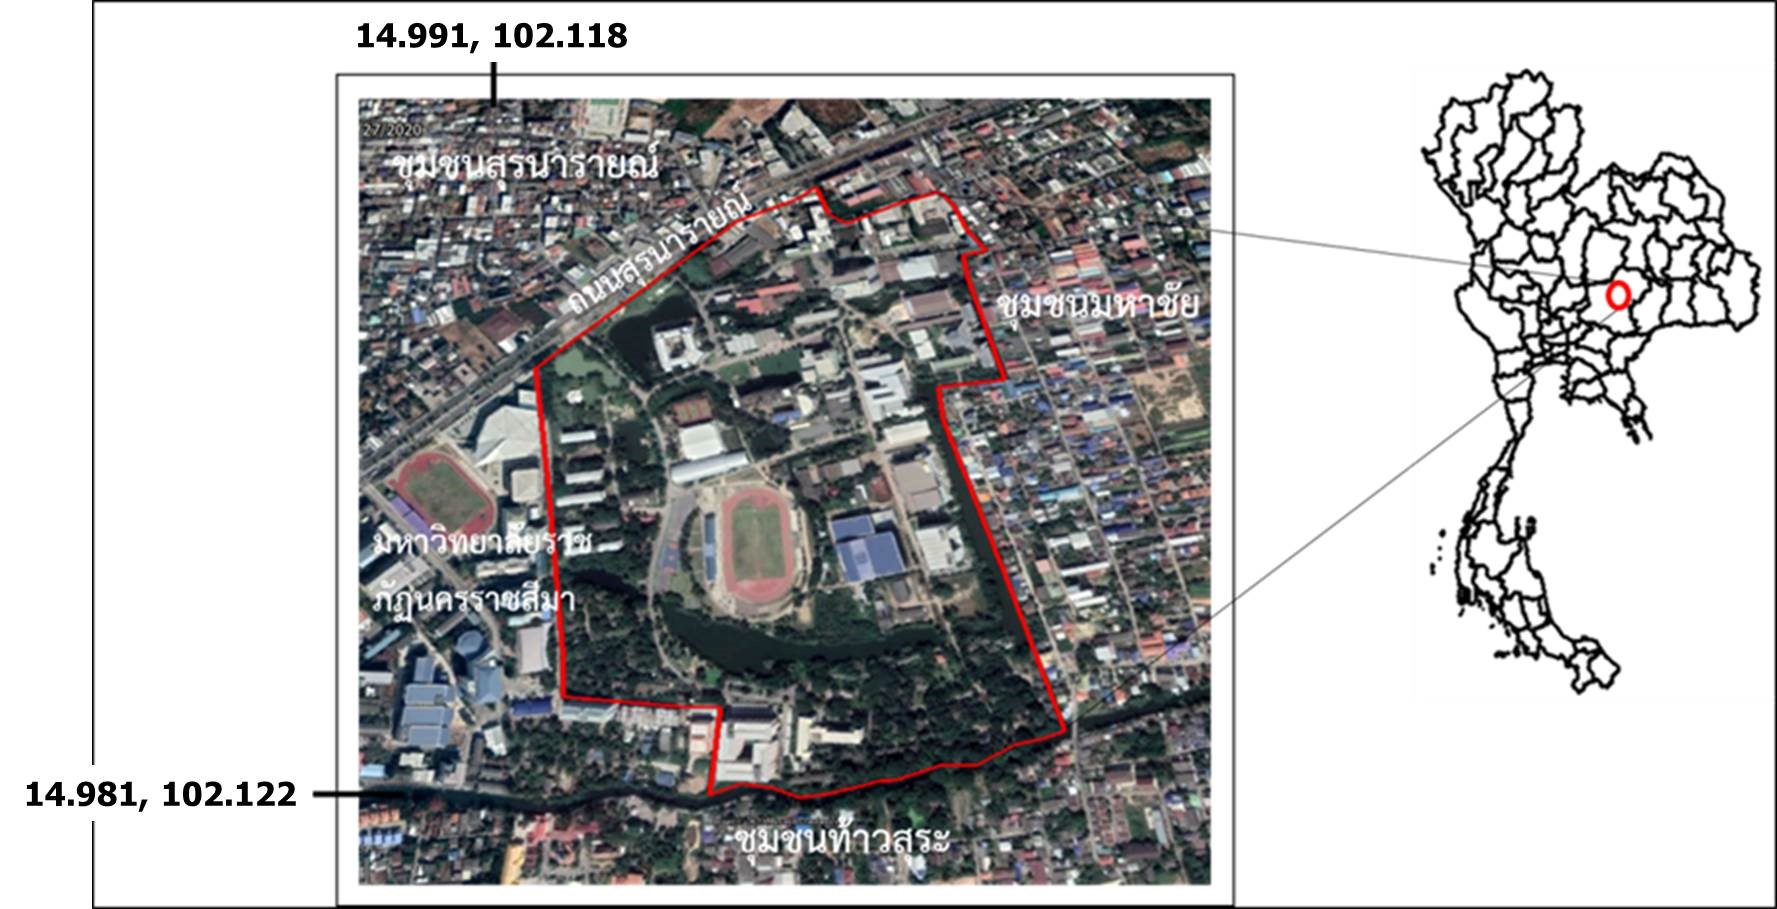
การประยุกต์ใช้ระบบสารสนเทศภูมิศาสตร์สำหรับการวิเคราะห์และการเปรียบเทียบเชิงพื้นที่และเวลาเพื่อศึกษาการกระจายของปริมาณและความหลากหลายชนิดของต้นไม้ในมหาวิทยาลัยเทคโนโลยีราชมงคลอีสาน
Main Article Content
Abstract
Yaowaret Jantakat
รับบทความ: 26 กุมภาพันธ์ 2565; แก้ไขบทความ: 7 กรกฎาคม 2565; ยอมรับตีพิมพ์: 12 กรกฎาคม 2565; ตีพิมพ์ออนไลน์: 6 พฤศจิกายน 2565
บทคัดย่อ
การศึกษานี้มีจุดประสงค์เพื่อวิเคราะห์และเปรียบเทียบเชิงพื้นที่และเวลาสำหรับการกระจายของปริมาณและความหลากหลายชนิดของต้นไม้ในมหาวิทยาลัยเทคโนโลยีราชมงคลอีสาน ที่ตั้งในตำบลในเมือง อำเภอเมืองนครราชสีมา จังหวัดนครราชสีมา ระหว่างปี พ.ศ. 2560 ถึง พ.ศ. 2564 ด้วยการคำนวณค่าดัชนีความหลากหลายด้วยวิธี Shanon–Wiener diversity index และการกระจายเชิงพื้นที่ของปริมาณและความหลากหลายชนิดของต้นไม้ด้วยเทคนิค average nearest neighbor ในโปรแกรมสารสนเทศภูมิศาสตร์ ผลการศึกษาพบว่า ในปี 2560 มีปริมาณต้นไม้ 1,375 ต้น และค่าดัชนีความหลากหลายของต้นไม้อยู่ระหว่าง 0.038–0.531 หรือเฉลี่ย 0.180±0.139 (72 ชนิด) และในปี 2564 มีปริมาณต้นไม้ 1,357 ต้น และค่าดัชนีความหลากหลายของต้นไม้อยู่ระหว่าง 0.070–0.540 หรือเฉลี่ย 0.184±0.127 (74 ชนิด) สำหรับการกระจายเชิงพื้นที่ด้วยเทคนิค average nearest neighbor ของปริมาณต้นไม้ในสองปีดังกล่าว โดยมีการกระจายในแบบเกาะกลุ่ม ซึ่งเป็นไปตามการกำหนดสมมติฐานแบบมีทิศทางโดยสมมติฐานหลัก (H0) ค่าดัชนีความหลากหลายเท่ากับ 1 (การกระจายในแบบเกาะกลุ่ม) และสมมติฐานทางเลือก (HA) ค่าดัชนีความหลากหลายมากกว่า 1 (การกระจายในแบบกระจาย) ที่ระดับนัยสำคัญ 0.01 ทั้งนี้พบการกระจายเชิงพื้นที่ของต้นไม้ในพื้นที่ศึกษาตามเส้นถนนบริเวณทางเท้า และที่รกร้างเป็นส่วนใหญ่ โดยมีชนิดพรรณเด่นของต้นไม้ คือ มะขาม ในปี พ.ศ. 2560 และกระถิน ในปี พ.ศ. 2564
คำสำคัญ: ระบบสารสนเทศภูมิศาสตร์ ความหลากหลายของชนิดต้นไม้ การวิเคราะห์เชิงพื้นที่และเวลา มหาวิทยาลัยสีเขียว
Abstract
This study aimed to analyze and compare spatio-temporal data for distribution of tree species quantity and diversity in Rajamangala University of Technology ISAN where locates in Ni–Muang sub–district, Muang district, Nakhonratchasima province between 2017 and 2021. Shanon–Wiener diversity index was used for calculating tree diversity and distribution of tree species quantity and diversity was analyzed by average nearest neighbor in GIS program. The results were found that, in 2017, there were totally 1,357 trees and diversity index was between 0.038–0.531 or average 0.180±0.139 (72 species) and, in 2021, there were totally 1,357 trees and diversity index was between 0.070–0.540 or average 0.1836±0.127 (74 species) in year 2021. For spatial distribution of such two years, there were a clustered pattern according to the mainly non-directional hypothesis (H0) with diversity index equal to 1 (clustering) and the alternative hypothesis (HA) with diversity index higher than 0 (dispersion) at significant level 0.01. The spatial distribution of trees in the study area was found mostly along roads on sidewalks and abandoned areas with tree dominance consist of Tamarin in 2017 and Acacia in 2021.
Keywords: Geographic information system, Tree diversity, Spatio–temporal analysis, Green university
Downloads
Article Details

This work is licensed under a Creative Commons Attribution-NonCommercial 4.0 International License.
References
Bartlett, P. F., and Chase, G. W. (2013). Sus-tainability in Higher Education: Stories and Strategies for Transformation. Mas-sachusetts: The MIT Press.
Bogerd, N., Dijkstra, S. C., Seidell, J. C., and Maas, J. (2018). Greenery in the university environment: Students’ preferences and perceived restoration likelihood. PLoS One 13(2): 1–19.
Columbia University Mailman School of Public Health. (2021). Spatiotemporal Analysis. Retrieved from https://www.publichealth. columbia.edu/research/population-health-methods/spatiotemporal-analysis, September 4, 2021.
Creighton, S. H. (1998). Greening the Ivory Tower: Improving the Environmental Track Record of Universities, Colleges, and Other Institutions. Massachusetts: The MIT Press.
DAYEH University Sustainability. (2021). What is a Green University? Retrieved from http://green.dyu.edu.tw/en_about.php, August 31, 2021.
Environmental Systems Research Institute. (2018). Space–time Cluster Analysis. Retrieved from https://pro.arcgis.com/en/ pro-app/latest/tool-reference/spatial-statistics/space-time-analysis.htm, September 4, 2021.
Environmental Systems Research Institute. (2021). How Average Nearest Neighbor works. Retrieved from https://pro.arcgis. com/en/pro-app/2.8/tool-reference/spatial-statistics/h-how-average-nearest-neighbor-distance-spatial-st.htm, September 4, 2021.
Goodchild, M. F. (2005). Geographic Information Systems. Retrieved from https://www.sciencedirect.com/topics/medicine-and-dentistry/spatiotemporal-analysis, September 4, 2021.
Google. (2019). Google Earth Engine. Retrieved from https://earthengine.google.com/terms/, September 4, 2021.
Jantakat, Y. (2017). Final report: Applied Geo–Informatics Technology towards Sustainability of In and Ex situ Plant Communities in Green Areas of RMUTI based on Ecological Niche Concept. Nakhonratchasima: Rajamangala University of Technology Isan. (in Thai)
Jantakat, Y. (2019). Spatiotemporal change for agricultural distribution from local administrative to provincial scales–based spatial clustering analysis. International Journal of Building, Urban, Interior and Landscape Technology 14(2): 67–80.
Jantakat, Y. (2021). Sustainable Development Approach of Green University in a Case of Rajamangala University of Techno-logy Isan. Retrieved from https://nriis.go.th, September 4, 2021. (in Thai)
Jantakat, Y., Juntakut, P., Plaiklang, S., Arree, W., and Jantakat, C. (2019). Spatiotemporal Change of Urban Agriculture Using Google Earth Imagery: A Case of Municipality of Nakhonratchsima City, Thailand. Retrieved from https://doi.org/ 10.5194/isprs-archives-XLII-2-W13-1301- 2019, September 4, 2021.
Kuisorn, W., Passworn, J., and Rattanaram, P. (2020). The exploratory and data re-search of perennial trees at Faculty of Architecture, King Mongkut’s Institute of Technology Ladkrabang for conservation. Architecture Journal 30(1): 18–33.
Liu, S. (2017). Sustainability. Retrieved from https://www.sciencedirect.com/topics/eng ineering/sustainable-development, August 31, 2021.
Margalef, R. (1958). Information theory in ecology. General Systematics 3: 36–71.
Marod, D. (2011). Sampling Technique and Plant Community Analysis. Retrieved from http://bioff.forest.ku.ac.th/PDF_FILE/ MAY_2011/DOKRAK_2011.pdf, September 4, 2021. (in Thai)
McFarland, A. L., Waliczek, T. M., and Zajicek, J. M. (2008). The relationship between student use of campus green spaces and persecutions of quality of life. American Society for HortTechnology 18(2): 232–238.
Morgan, C. (2009). Climate change, uncertainty and prehistoric hunter–gatherer mobility. Journal of Anthropological Archaeo-logy 28(4): 382–396.
Nordstrom, M., Pfeiffer, D., and Jarp, J. (2000). A space–time cluster investigation of an outbreak of acute respiratory disease in Norwegian cattle herds. Preventative Vet-erinary Medicine 47(1–2): 107–119.
Office of Natural Resources and Environmental Policy and Planning. (2007). Policy Action Plan for Sustainable Urban Green Area Management. Retrieved from http://www.onep.go.th/ebook/eurban/eurban-publication-06.pdf, September 1, 2021. (in Thai)
Perry, G., Miller, B., and Enright, N. (2006). A comparison of methods for the statistical analysis of spatial point patterns in ecology. Plant Ecology 187: 59–82.
Rajamangala University of Technology Isan. (2021). History of University. Retrieved from https://rmuti.ac.th/main/about/history/, September 2, 2021. (in Thai)
Simpson, E. H. (1949). Measurement of diversity. Nature 163: 688. https://doi.org/10.1038/163688a0.
The University of Sheffield. (2021). Sustainability at Sheffield. Retrieved from https://www.sheffield.ac.uk/sustainability/green-spaces, January 19, 2022.
UCGIS. (2016). Point Pattern Analysis. Retrieved from https://gistbok.ucgis.org/bok-topics/point-pattern-analysis, September 4, 2021.
UNESCO. (2021). Sustainable Development. Retrieved from https://en.unesco.org/themes/education-sustainable-development/what-is-esd/sd, August 31, 2021.
University of Southampton. (2021). Spatio–Temporal Data – Patterns using GIS. Retrieved from http://generic.wordpress. soton.ac.uk/gem/unit-6/6-6-spatio-temporal-data-patterns-using-gis/, September 4, 2021.
Wilkins, D., and Ford, R. (2007). Nearest neighbor methods applied to dune field organization: The Coral Pink Sand Dunes, Kane County, Utah, USA. Geomorphology 83 (1–2): 48–57.
